Bar graph
Bar graph: Overview
This topic covers concepts, such as, Bar Graphs, Representing Data in Bar Graphs, Drawing Bar Graphs & Choosing Scales to Draw Bar Graphs etc.
Important Questions on Bar graph
Study the following graph carefully and answer the given question. Number of students (Males & Females) passed out from various colleges in a year. (Number in thousands) is shown below:
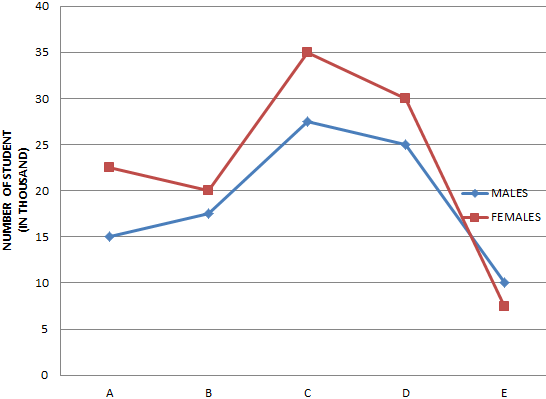
COLLEGES
What is the average number of students (Males & Females) passed out from all the colleges together?
The figure shows the Sales(S), Expenses(E) and the Equity Base (EB) of a company XYZ Ltd. over different years in Crore.
I. Profit = Sales – Expenses
II Share holders’s Return = profit / Equity Base
III Profitability = Profit / Sales
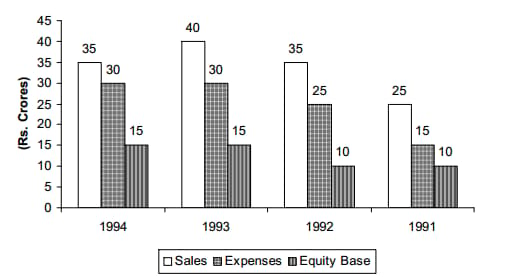
Maximum profitability is attained in which year?
Home appliances like fridge and television consume electrical energy. Jiya made a bar graph of the electricity consumption of six appliances in her house in a year.
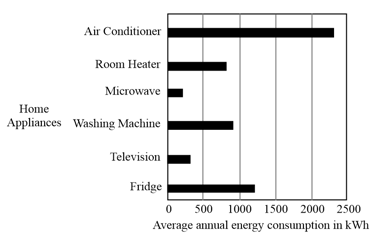
Jiya represents the energy consumption of a microwave and a television as given below.
Microwave – 
Television – 
How much energy consumption (in ) does a  represent?
Bar graph is used to represent data in continuous elements.
What is a bar graph? What are the disadvantages of using a bar graph?
A survey of people asked them "Which is the nicest fruit?':
| Fruit | Apple | Orange | Banana | Kiwifruit | Blueberry | Grapes |
| People |
Represent the given data in a bar graph.
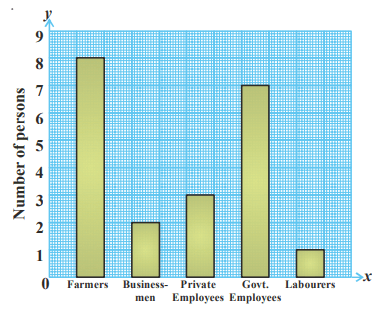
The bar graph shows the number of persons in a certian profession.
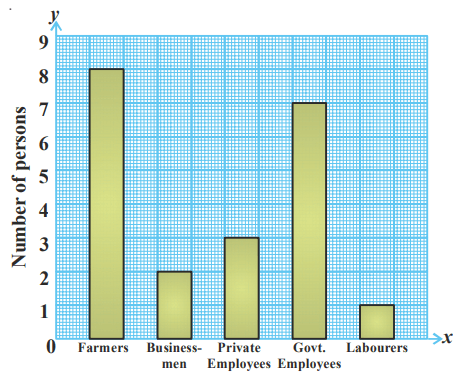
Which profession has the most number of persons?
The bar graph shows the number of persons in a certian profession.
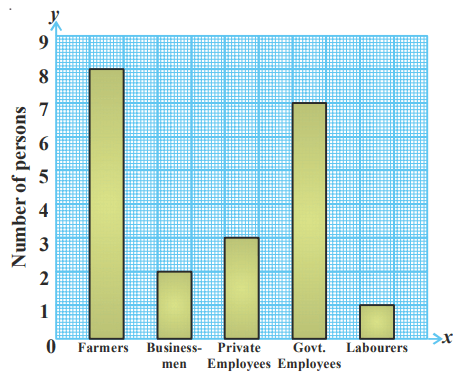
Which profession has the least number of persons? Write one advantage of using a bar graph.
A bar graph does not help to summarise a large data set in visual form.
A bar graph shows each data category in a _____ distribution.
Each bar or column in a bar chart is of equal width.
The professions of people living in a colony are given below:
| Profession | Farmers | Private Employee | Businessmen | Goverment employee | Labourers |
| Number of people |
Represent the data with the most suitable graph.
This chart was used in an article that claimed, 'High school graduation rates have increased dramatically under new government!'
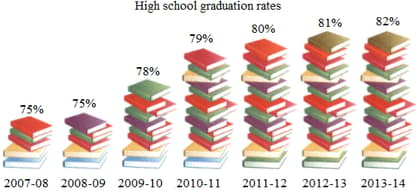
Draw a graph that would represent the data more fairly and effectively.
The two graphs shown here represent the same data regarding child labour.
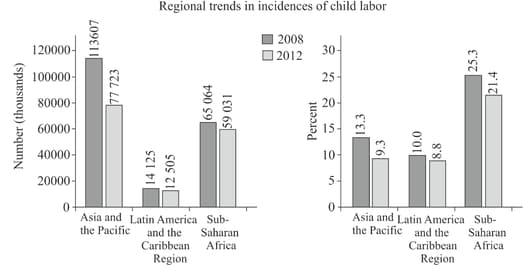
Is either graph 'wrong'? Explain why someone would prefer to create the first graph instead of the second one.
Look at the bar graph given below:
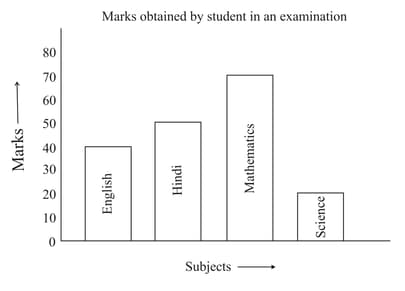
In which subject the student's performance is poorest
Draw a bar-chart to represent the following data :
|
Name of animal |
Goat |
Horse |
Cow |
Camel |
Elephant |
|
Age (in years) |
12 |
15 |
15 |
26 |
60 |

